Comprehensive Guide to Factors Affecting the Value of Your RV Park or Campground
Your campground’s value is essentially what an informed buyer would pay for its future earnings and potential for growth. Understanding this is key when you’re ready to sell. This guide breaks down the core ways to assess value—looking at Net Operating Income (NOI), capitalization rates (cap rates), and comparable sales. We’ll show you how things like location, amenities, financial performance, how you run things, and market trends all come together to shape the selling price. When you get these concepts, you can focus on the improvements that will boost revenue, make your park seem less risky, and attract better offers, all while keeping the legacy and character of your operation intact. We’ve laid out clear steps for quickly estimating value, identifying upgrades with the best return on investment, and getting your documentation and marketing ready for sale. Throughout, we’ve woven in keywords like “how do you value an RV park,” “net operating income campground,” and “cap rate for RV parks 2025,” along with checklists and examples designed for owners like you, making valuation a practical step in your selling journey.
What Are the Key Methods to Determine the Value of Your RV Park or Campground?
When valuing an RV park or campground, we primarily use three approaches: an income-based valuation focused on Net Operating Income (NOI), a market-based valuation that uses the Capitalization Rate (cap rate) to translate NOI into a price, and a comparable sales analysis that adjusts recent transaction data based on differences in site count, amenities, and location. Each method addresses different buyer questions: NOI and cap rate quantify the cash-flow value, comparables anchor the price to local market evidence, and asset-based checks look at the underlying land and replacement costs. Understanding how each method works and why buyers might favor one over another will help you avoid surprises when offers come in and during due diligence. In the following sections, we’ll define NOI, cap rate, and comparables, complete with formulas, examples, and practical pros and cons, so you can run a quick sanity check before you start inviting offers.
How Is Net Operating Income Calculated and Why Does It Matter?
Net Operating Income (NOI) represents the property’s cash flow before accounting for debt service and taxes. It’s a measure of the earnings a buyer can anticipate from the park’s operations. NOI is calculated by taking your Gross Operating Revenue and subtracting Operating Expenses, along with any Vacancy or Collection Losses. It’s crucial because buyers use it as the foundation for income-based valuations; a more predictable NOI attracts lower cap rates and, consequently, higher prices. Typical revenue sources include nightly and seasonal site fees, long-term site leases, cabin or glamping rentals, sales from your store and food & beverage operations, and other services like laundry and propane. Common operating expenses encompass payroll, utilities, maintenance, property taxes, insurance, marketing, and reservation fees. For valuation clarity, it’s important to normalize any one-off owner benefits. Tracking NOI on a trailing 12-month basis, with adjustments for seasonality, provides buyers with a clear picture of sustainable cash flow and supports a credible asking price.
The interplay of different revenue streams and expense categories creates your NOI. Understanding these components helps you pinpoint the most impactful improvements for increasing your park’s value. To illustrate how these elements combine to form NOI, the table below breaks down representative components with example values, offering a helpful way for you to audit your own statements.
This table, presented in an EAV (Estimated Annual Value) style, clarifies how individual components contribute to the NOI figure that buyers scrutinize. When you can provide detailed line-item breakdowns for each component, you significantly reduce valuation risk and help buyers feel more confident underwriting a purchase.
What Is the Capitalization Rate and How Does It Influence Selling Price?

The capitalization rate, or cap rate, is the ratio of NOI to property value, essentially reflecting the market’s required rate of return: Value = NOI / Cap Rate. The cap rate encapsulates market risk and growth expectations. A lower cap rate means a higher valuation for the same NOI, while a higher cap rate suggests greater perceived risk or lower growth prospects. Factors influencing the cap rate include the strength of the regional market, the property’s condition, the stability of its occupancy, the diversity of its revenue streams, and the level of buyer competition. For instance, a campground generating $250,000 in NOI priced at an 8% cap rate would imply a value of approximately $3.125 million. The same NOI at a 10% cap rate would result in a value of $2.5 million. Understanding this inverse relationship helps you see how even modest increases in NOI or slight decreases in cap rates can lead to substantial changes in price. It also guides your pre-sale efforts toward either improving NOI or reducing perceived risk to compress the cap rate.
Here’s a brief list of typical cap-rate drivers that you can influence:
- Occupancy Stability: Consistent, predictable occupancy reduces perceived risk and supports lower cap rates.
- Property Condition: Updated utilities and facilities minimize immediate capital expenditure needs for buyers and signal lower risk.
- Revenue Diversification: Adding cabins, glamping options, and ancillary income streams reduces over-reliance on transient site nights.
These drivers directly connect to the renovation and operational priorities we’ll discuss later, guiding where your investment will most effectively influence a buyer’s valuation assumptions.
How Do Comparable Sales Help Estimate Campground Value?
Comparable sales analysis involves using recent, similar transactions to help triangulate an asking price. This method requires adjusting for differences in site count, amenities, revenue, and location quality. It’s particularly effective in markets with active trading and multiple recent campground or RV park sales, and it helps validate income-based estimates by grounding them in what buyers have actually paid. Key attributes for comparison include the number of sites, average revenue per site, the presence of cabins or glamping, utility capacity, and proximity to major attractions or highways. Since comparable sales rely on market data, you should seek sales records from brokers, industry reports, and public transaction databases. Be prepared to explain any adjustments made for outliers or unique property characteristics.
A straightforward comparable checklist can help structure your adjustments:
- Identify sales within your region that occurred within the last 24 months.
- Normalize revenue and expense items to account for one-off events or owner perks.
- Adjust price per site or price per revenue multiple to reflect differences in amenities or location.
Comparable analysis is most persuasive when paired with clean financials and a clear narrative explaining why your park is similar to or superior to the listed comparables. This combination quickly builds buyer confidence and narrows negotiation gaps.
After reviewing the NOI, cap rate, and comparable approaches, some owners prefer to get a confidential, buyer-side perspective on value before deciding to list. GatherGrounds Resorts offers the acquisition of RV parks and campgrounds from owners looking to sell, and we can provide a no-obligation, buyer-side valuation conversation tailored to your specific goals. This option can be particularly beneficial for sellers who prioritize a respectful transition and direct communication regarding offer timing and terms.
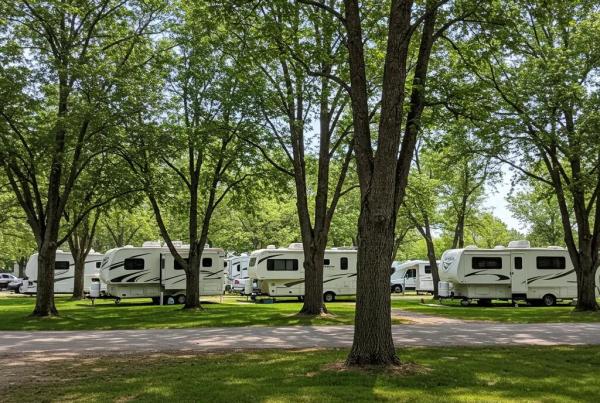
How Does Location Affect the Value of Your RV Park or Campground?
Location significantly influences demand, the rates you can charge, and the pool of potential buyers. It operates through factors like accessibility, proximity to attractions, road visibility, and seasonal demand patterns. Parks with strong highway access and close proximity to tourist destinations typically command higher average daily rates and better occupancy. Conversely, remote sites with niche appeal might trade at a discount, often tied to limited seasonal windows. Local zoning and land-use regulations further impact value by either enabling or restricting expansion. Market trends, such as regional tourism growth or population shifts, can alter long-term demand trajectories. You should evaluate both the physical and regulatory aspects of your location to fully understand its value drivers.
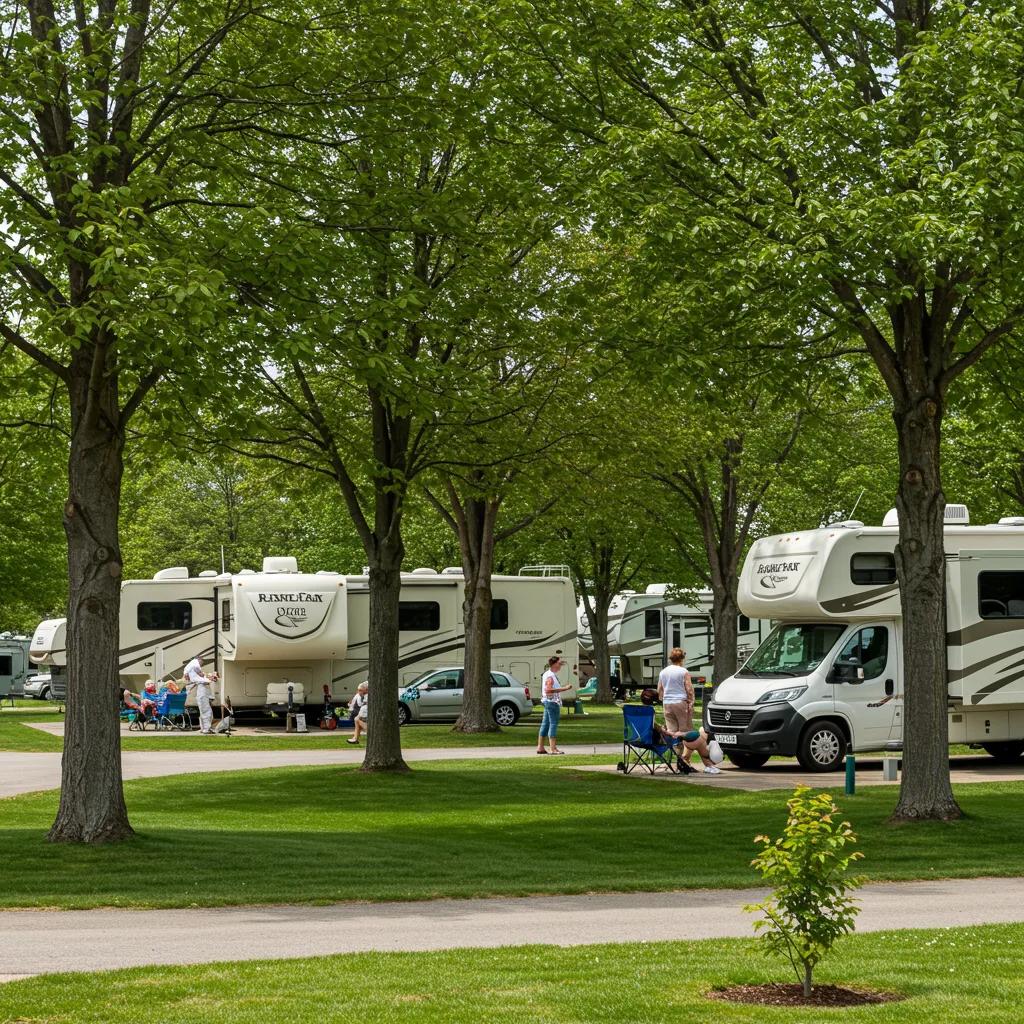
What Location Factors Increase Campground Worth?

Key location elements that significantly boost value include proximity to highways, a strong surrounding population base, adjacency to major attractions, and ease of access with good ingress and egress. These factors drive higher transient occupancy and allow for premium pricing on peak nights. The seasonal climate and local tourism calendars dictate occupancy profiles and influence the length of your revenue season. Visibility and effective signage on high-traffic roads can increase spontaneous transient bookings. A simple scoring framework—evaluating access, visibility, nearby demand generators, and population within a 60-mile radius—can help you rate your location’s strengths and identify marketing or amenity strategies to compensate for weaker attributes. Improving wayfinding, establishing partnerships with local attractions, and implementing targeted regional marketing can enhance your location’s appeal without requiring major capital investment.
To help you compare location attributes and their typical impact on value, the table below outlines common factors and their direction of influence.
This location-focused EAV table provides a framework for understanding which geographic attributes are most easily optimized through marketing efforts and which might require strategic repositioning or development to capture added value.
How Do Zoning Regulations and Land Use Impact Property Value?
Zoning and land-use regulations dictate what a buyer can operate or build on your site, directly affecting expansion potential, permitted overnight stays, and the ability to add structures like cabins or glamping units. Properties zoned for commercial recreation offer buyers more flexibility for upside, whereas agricultural or restrictive residential zoning often necessitates conditional use permits or rezoning to expand operations. Before valuation discussions, you should gather zoning maps, conditional use permits, and documentation on utility capacity. Clarity regarding permitted uses reduces friction during transactions. Identifying constraints early—such as setback rules, septic and well limitations, or site density caps—allows you to present mitigation strategies or phased expansion plans that help preserve value.
The complexity of permitting can also affect the speed of market entry for expansions. Buyers will factor permit risk into their valuation, potentially applying higher cap rates unless you can demonstrate prior approvals or a clear path to entitlement. Providing documentation of past approvals and any pre-application feedback from local planners strengthens your position as a seller.
Why Is Market Trend Analysis Important for Location Valuation?
Market trends—including population shifts, regional tourism growth, and the rise of remote work—influence both short-term booking behavior and long-term valuation expectations. For example, areas experiencing inbound population growth often see extended-season demand and rising Average Daily Rates (ADRs). Conversely, regions heavily reliant on single-event tourism can be quite volatile. The ongoing trend of remote work continues to favor campgrounds that offer work-friendly amenities, attracting longer stays and increasing mid-week occupancy. You should utilize local tourism board reports, regional economic data, and occupancy trend lines to forecast demand and adjust your valuation assumptions accordingly.
When you can present evidence of trend-based growth—such as multi-year increases in occupancy or a rise in direct bookings—you reduce perceived market risk and can justify a lower cap rate. Combining a strong location with compelling trend data is highly persuasive to buyers seeking growth markets.
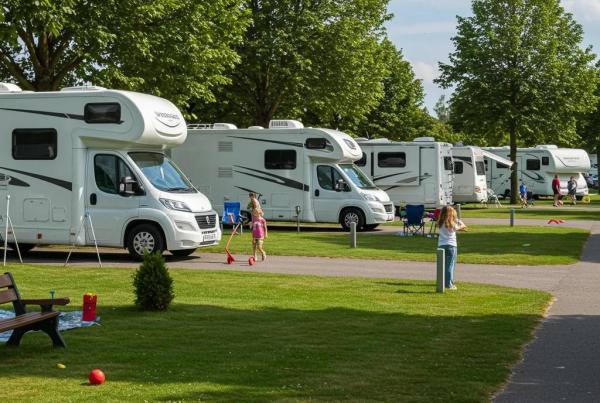
Which Amenities and Guest Experience Features Boost RV Park Value?
Amenities and the overall guest experience directly impact how much revenue each site can generate and how resilient your occupancy is across different seasons. Buyers highly value features that increase ADR, extend length of stay, and encourage ancillary spending. High-speed Wi-Fi, full hookups with concrete pads, upgraded bathhouses, glamping and rental cabins, and on-site laundry are consistently linked to higher occupancy and improved guest reviews. Technology, including reservation systems, channel management, and dynamic pricing, also boosts conversion rates and provides the data buyers use to underwrite revenue growth. Prioritizing amenities with a proven track record of revenue uplift is far more effective than making scattered upgrades.
How Does High-Speed Wi-Fi and Technology Improve Campground Worth?
High-speed Wi-Fi and integrated reservation technology enable remote workers and long-term guests to stay at your park and pay premium rates, directly boosting mid-week occupancy and average length of stay. Reservation systems help reduce no-shows, facilitate dynamic pricing, and centralize guest data, leading to more predictable revenue streams and measurable Key Performance Indicators (KPIs) that buyers value. Technology investments also enhance guest satisfaction and online reviews, which in turn increases direct bookings and lessens reliance on third-party channels. Implementation options range from mesh networks and managed Wi-Fi providers to partnerships with local Internet Service Providers (ISPs); your choice will depend on site layout, bandwidth requirements, and budget.
The payoff from technology is twofold: operational improvements, such as reduced staff hours and better revenue management, and financial gains, including higher ADRs and lower vacancy rates. Presenting post-implementation metrics like conversion rates and RevPAR (Revenue Per Available Room) equivalents during sale discussions effectively translates technology investments into valuation uplift.
What Are the Top Amenities That Maximize Selling Price?
Prioritizing amenities based on cost versus revenue uplift helps you focus capital on the highest-return items. Bathhouse upgrades, reliable full hookups and concrete pads, and additions like glamping tents or small cabins typically deliver strong ADR increases. Laundry facilities and a basic store can enhance ancillary income and guest convenience. Pools and large recreation spaces can boost demand but often come with higher maintenance and insurance overhead, so their return on investment depends heavily on market demand and utilization. The table below compares common amenities, showing typical implementation costs and expected occupancy/ADR uplift.
This EAV comparison provides you with a framework to evaluate capital expenditures against expected financial uplift and buyer appeal.
You should present costed plans and recent usage metrics for any new amenities to strengthen your valuation case. Documented increases in ADR and occupancy following upgrades materially reduce buyer uncertainty.
How Do Guest Reviews and Occupancy Rates Affect Valuation?
Guest reviews and occupancy history serve as direct indicators of revenue predictability and operational quality, influencing both buyer perception and the cap rate selection. Higher average ratings improve conversion rates across Online Travel Agencies (OTAs) and direct booking channels. Stable year-over-year occupancy reduces perceived downside risk, allowing buyers to accept lower cap rates. As a seller, you should track KPIs such as Average Daily Rate (ADR), occupancy by season, revenue per site, and review score trends to present a compelling operational narrative. Improving your practices for responding to reviews and actively soliciting feedback after stays are low-cost methods to quickly boost your park’s reputation.
A focused reporting package that links improvements in reviews to outcomes in occupancy and ADR transforms subjective guest sentiment into objective underwriting data, which buyers highly value when determining an offer price and terms.
How Do Financial Performance and Operational Efficiency Influence RV Park Value?
Buyers meticulously examine financial metrics and operational processes to assess future profitability and risk. Clean, standardized reporting builds trust and often accelerates transactions. Core metrics include NOI, gross revenue, operating margin, occupancy rate, ADR, and revenue per site. Buyers typically expect trailing 12-month statements, ideally with seasonality splits and normalized expenses. Operational efficiency—encompassing reservation systems, staffing models, preventive maintenance, and utility management—translates directly into higher margins and fewer unexpected capital expenditures during due diligence. Preparing organized, transparent financials and demonstrating best operational practices often leads to better offers and smoother closings.
What Financial Metrics Should Sellers Prepare for Valuation?
Sellers should prepare a structured package that clearly presents NOI, gross revenue broken down by stream, operating margin, ADR, and occupancy by month, along with revenue per site. This should include a trailing 12-month view and comparisons to prior years to illustrate trends. Each metric should be accompanied by calculation definitions and any necessary normalizations, such as adjustments for owner perks, one-time capital spending, or impacts from atypical events. Buyers will also expect a forecast based on documented assumptions. Providing both a conservative and an upside forecast, tied to recent marketing or amenity improvements, helps buyers calibrate their offers. Presenting these metrics in simple tables or dashboards makes the financial story easy to underwrite.
A standardized set of KPIs reduces the back-and-forth during diligence and supports a valuation anchored in demonstrated performance rather than optimistic anecdotes.
How Does Clean Financial Documentation Build Buyer Trust?
Transparent, well-organized documentation—including P&L statements, tax returns, occupancy reports, utility invoices, vendor agreements, and capital improvement records—reduces perceived risk and shortens negotiation timelines. Buyers often apply discounts for unclear records or undisclosed liabilities. Proactively resolving any red flags (e.g., undocumented vendor credits, inconsistent revenue reporting) helps preserve value. Organize a sale binder with clearly labeled sections for revenue streams, expense categories, permits, and site plans to give buyers rapid access to the information they need. Having records readily available for a CPA or third-party reviewer demonstrates your diligence and signals your seriousness as a seller.
Clear documentation also helps justify any adjustments made during comparable analysis or when presenting normalized NOI to potential buyers.
What Operational Improvements Can Increase Profitability Before Selling?
Operational changes that yield measurable uplifts include implementing or optimizing reservation systems, instituting dynamic pricing strategies, standardizing check-in processes, and introducing preventive maintenance schedules to minimize emergency repair costs. Reservation platforms and channel managers reduce cancellations and increase conversion rates, while dynamic pricing allows you to capture higher ADRs on peak dates. Cost controls—such as implementing LED lighting, water-conservation measures, and renegotiating vendor contracts—can improve margins without compromising the guest experience. Quick wins typically become apparent within a season and can be documented to support revised revenue assumptions during sale discussions.
A prioritized list of operational improvements, tied to expected percentage uplifts and timelines, helps you decide which initiatives to undertake before listing your park.
What Role Do Market Trends and Expansion Potential Play in Campground Valuation?
Macro trends and property-specific expansion opportunities significantly influence future earnings potential and, consequently, current valuation. Trends like increasing demand for long-term stays, the adoption of remote work, and inventory constraints are driving buyer interest toward parks with flexible amenities and room for growth. Expansion opportunities—such as adding more sites, cabins, glamping units, or event spaces—can materially increase NOI, provided that utility and permitting constraints are manageable. Regional cap rate variations reflect local economic health, tourism trends, and buyer competition; buyers will adjust cap rates to reflect perceived future growth. Owners who can document scalable expansion plans and demonstrate support from local trends can command higher prices.
How Are Long-Term Stay and Remote Work Trends Affecting RV Park Demand?
The rise of remote work and longer average stays have increased demand for parks offering reliable Wi-Fi, work-friendly sites, and on-site amenities, leading to higher mid-week occupancy and extended lengths of stay. Parks that position themselves to attract extended-stay guests by offering competitive monthly rates, dependable utilities, and quiet work zones capture a higher-margin niche. Marketing tactics targeting remote workers and digital nomads—such as longer-stay packages, partnerships with coworking spaces, and targeted advertising—help convert this demand into measurable revenue. Buyers view parks that have already successfully captured this segment as lower-risk growth assets.
Demonstrating a track record of increased average length of stay or higher mid-week bookings provides persuasive evidence for a growth-oriented valuation.
What Expansion Opportunities Can Increase Property Value?
Common expansion paths include adding RV sites (subject to utility capacity), installing glamping units or cabins, and creating event or recreation spaces that attract group bookings. Before pursuing expansion, you should carefully evaluate water/sewer/electrical capacity, site grading, roadway access, and local permitting requirements. Failing to assess these constraints can undermine your expected return on investment. Phased expansion—starting with a few high-margin units and scaling based on demand—reduces capital risk and provides buyers with documented demand signals. Presenting a feasible, costed expansion plan with projected incremental NOI helps buyers underwrite potential upside when assessing offers.
A concise feasibility checklist can help both owners and buyers quickly assess practical expansion potential and associated timelines.
How Do Regional Cap Rate Variations Reflect Market Conditions?
Cap rates vary by region based on the balance of supply and demand, local economic growth, tourism trends, and transaction liquidity. Stronger markets typically exhibit lower cap rates (e.g., 7%–8%), while weaker or higher-risk markets trade at higher cap rates (10%–12%+). Buyers use regional cap rate ranges to calibrate their offers against local risk factors. Elements such as rising tourism, population growth, or constrained inventory typically compress cap rates. You should research recent local sales and industry reports to establish a realistic cap rate band for your property and be prepared to present evidence—like occupancy trends and ADR gains—that supports selecting a lower cap rate within that band.
Providing examples of regional sales and relevant trend data helps reduce buyer uncertainty and supports a defensible cap rate assumption.
How Can You Strategically Increase Your RV Park’s Value Before Selling?
A focused pre-sale plan combines high-ROI capital projects, operational efficiencies, and improved marketing and documentation to boost NOI and reduce perceived buyer risk. Prioritize projects that either increase ADR and length of stay (e.g., cabins, glamping, upgraded hookups) or eliminate immediate capital needs for buyers (e.g., infrastructure, bathhouse repairs). Complement capital expenditures with reservation system upgrades, dynamic pricing, and a clean financial binder to present a ready-to-operate asset. The following H3 subsections outline key renovations, digital strategies, and a seller-ready timeline.
What Renovations and Upgrades Yield the Highest Return?
High-return renovations typically include modernizing bathhouses, upgrading electrical and sewer capacity to accommodate premium sites, adding concrete pads and full hookups, and introducing glamping or small rental cabins where market demand supports higher ADRs. Bathhouse and utility upgrades reduce buyer hesitation by minimizing near-term capital expenditure needs, while glamping and cabins broaden the market appeal and often produce substantial ADR uplift. Prioritize improvements that increase revenue or materially reduce maintenance headaches, and document costs and early performance metrics so buyers can see the realized uplift. Phased projects allow you to test demand before a full rollout, de-risking capital spending.
- Bathhouse and utility reliability: Reduces buyer capex concerns and enhances the guest experience.
- Full hookups and concrete pads: Attracts long-term guests and commands higher rates.
- Glamping/cabins: Increases ADR and appeals to new guest segments.
When you prefer guidance from an experienced operator on which upgrades most reliably increase saleability, GatherGrounds Resorts—whose services include acquiring RV parks and campgrounds from owners looking to sell—possesses practical implementation experience post-acquisition and can advise on which upgrades most reliably attract buyer interest. This buyer-side insight can help you prioritize improvements that yield measurable valuation uplift.
How Does Implementing Digital Marketing and Reservation Systems Help?
Modern reservation systems and effective digital marketing increase occupancy and provide essential data for underwriting revenue improvements. They also reduce reliance on commission-bearing channels by boosting direct bookings. Key reservation features to prioritize include channel management, dynamic pricing capabilities, group-block handling, and reporting dashboards that display conversion rates and ADR by channel. Digital marketing efforts—such as Search Engine Optimization (SEO), targeted social media ads, and email campaigns—extend awareness into shoulder seasons and support repeat bookings. After implementation, track metrics like conversion rate, cancellation rate, ADR by channel, and direct booking percentage to quantify the benefits for potential buyers.
What Are Best Practices for Preparing Your Campground for Sale?
A 90/60/30-day timeline with prioritized tasks helps you present a market-ready property. In the 90-day phase, organize your financials and begin implementing quick operational improvements. At the 60-day mark, complete visible repairs and gather necessary permits and site plans. In the final 30 days, focus on polishing guest-facing areas and preparing a concise seller summary. Essential documentation includes your trailing 12-month P&L, tax returns, occupancy reports, vendor agreements, and permits. Address minor deferred maintenance to avoid price erosion during inspections, and ensure a clear history of capital improvements is available to buyers. A concise seller summary highlighting your park’s strengths, opportunities, and recent improvements helps focus buyer due diligence and supports your asking price.
Utilize a sale binder and a brief property one-pager to streamline buyer review and reduce negotiation friction.
What Are Common Questions About Selling and Valuing Your Campground?
This FAQ-style section addresses frequent seller queries regarding quick value estimates, cap rate expectations for 2025, the impact of glamping or solar energy on value, and whether to use a broker or sell directly to a buyer. Short, direct answers are provided to help you decide on your next steps and identify which documents to prepare for faster, higher-quality offers.
How Quickly Can I Estimate the Value of My RV Park?
You can generate a rapid estimate using the formula: Value = NOI / Cap Rate. Calculate your trailing 12-month NOI, select a market-appropriate cap rate band, and divide to arrive at a value range. This quick method is useful for sanity checks but doesn’t account for due diligence items like deferred maintenance, entitlements, or utility constraints that buyers will investigate. For greater accuracy, present a normalized NOI (excluding owner perks and one-time items) and compare it to local comparable sales to triangulate a price range. Gathering recent financials and a summary of site and amenity counts will enable a faster and more credible preliminary valuation.
What Is a Good Cap Rate for RV Parks in 2025?
In recent market conditions, common cap rate ranges for RV parks typically span approximately 7%–12%. Lower cap rates are generally found in strong, growth markets, while higher cap rates are associated with properties facing operational or market risks. Cap rate selection depends on factors such as region, property condition, occupancy history, revenue diversity, and projected growth. Parks located in high-demand tourist regions with stable occupancy will likely fall at the lower end of this range. You should research recent local sales and buyer activity to refine the appropriate cap rate band for your property and support your pricing rationale with trend data and comparable transactions.
How Does Adding Glamping or Solar Energy Affect Property Value?
Glamping or rental cabins commonly increase ADR and broaden guest demographics, offering clear revenue upside if demand exists. You should model expected occupancy and ADR to estimate the incremental NOI. Solar installations reduce operating expenses and may appeal to eco-conscious buyers, but they require careful evaluation of permitting, interconnection agreements, and upfront capital expenditures. Both initiatives can enhance buyer interest and support a lower cap rate if they demonstrably improve margins or marketability, but only if regulatory and utility factors are resolved or well-documented. Include permitting and ROI projections when presenting these enhancements to buyers.
Should I Use a Real Estate Agent or Sell Directly to a Buyer Like GatherGrounds Resorts?
Agents and brokerages offer broad market exposure and can attract multiple buyers, potentially maximizing price but typically involving longer timelines and commission fees. They are most suitable when broad market competition is desired. Selling directly to a qualified buyer can lead to faster closings, greater confidentiality, and simpler negotiations. The trade-offs include potentially reduced marketing exposure but a smoother transition process. For owners who prioritize a respectful transfer that preserves the property’s character, consider buyer organizations that emphasize thoughtful transitions. GatherGrounds Resorts, which focuses on acquiring RV parks and campgrounds from owners looking to sell, positions itself as a direct-buyer option for owners seeking a family-owned approach and a respectful transition during sale conversations.
This final FAQ set provides owners with rapid, actionable guidance and suggests next steps for more in-depth valuation work.
Frequently Asked Questions
What are the most effective marketing strategies for RV parks?
Effective marketing strategies for RV parks include leveraging digital marketing techniques such as search engine optimization (SEO), social media advertising, and email campaigns. Creating engaging content that highlights unique features and local attractions can attract potential guests. Additionally, utilizing online travel agencies (OTAs) and maintaining a user-friendly website with an easy booking system can enhance visibility. Offering promotions during off-peak seasons and encouraging guest reviews can also boost occupancy rates and improve overall marketing effectiveness.
How can I assess the competition in my area?
To assess competition, start by identifying other RV parks and campgrounds within your region. Analyze their amenities, pricing, occupancy rates, and guest reviews. Tools like online travel agency listings and local tourism websites can provide insights into competitor offerings. Additionally, visiting competitor sites can help you understand their guest experience and marketing strategies. This competitive analysis will inform your pricing, marketing, and operational decisions, allowing you to position your park effectively in the market.
What role do guest amenities play in attracting long-term stays?
Guest amenities significantly influence the attractiveness of RV parks for long-term stays. Features such as high-speed Wi-Fi, full hookups, laundry facilities, and recreational areas enhance the overall guest experience. Parks that offer additional services like community events, pet-friendly policies, and on-site dining options can further appeal to long-term guests. By providing a comfortable and convenient environment, RV parks can increase occupancy rates and encourage repeat visits, ultimately boosting revenue and enhancing property value.
How can I improve my park’s online reputation?
Improving your park’s online reputation involves actively managing guest feedback and encouraging positive reviews. Responding promptly to reviews—both positive and negative—demonstrates commitment to guest satisfaction. Implementing a guest feedback system can help identify areas for improvement. Additionally, showcasing positive testimonials on your website and social media can enhance credibility. Regularly updating your online presence with engaging content and high-quality images of your park can also attract potential guests and improve overall perception.
What are the benefits of offering seasonal pricing?
Offering seasonal pricing allows RV parks to optimize revenue by adjusting rates based on demand fluctuations throughout the year. During peak seasons, higher rates can capitalize on increased demand, while lower rates in off-peak times can attract budget-conscious travelers. This strategy can help maintain occupancy levels year-round, maximizing revenue potential. Additionally, seasonal pricing can encourage longer stays during slower periods, providing guests with incentives to book extended visits, which can enhance overall profitability.
How can I prepare for a successful sale of my RV park?
Preparing for a successful sale involves several key steps. First, ensure your financial documentation is organized and transparent, including profit and loss statements, occupancy reports, and maintenance records. Next, consider making strategic improvements to enhance property appeal, such as upgrading amenities or addressing deferred maintenance. Additionally, conducting a market analysis to set a competitive asking price is crucial. Finally, consider working with a real estate professional or a buyer-focused organization to navigate the selling process effectively.
What are the key factors that influence buyer interest in RV parks?
Key factors influencing buyer interest in RV parks include location, financial performance, and property condition. Buyers typically seek parks with strong occupancy rates, diverse revenue streams, and potential for growth. Amenities that enhance guest experience, such as Wi-Fi and recreational facilities, also play a significant role. Additionally, clear and organized financial documentation builds trust and reduces perceived risk. Understanding these factors can help sellers position their properties more effectively to attract serious buyers.
Conclusion
Understanding the factors that influence the value of your RV park or campground is crucial for maximizing your return on investment. By leveraging insights on valuation methods, location attributes, and operational efficiencies, owners can make informed decisions that enhance property appeal and profitability. Taking proactive steps to improve amenities and financial documentation can significantly attract potential buyers and streamline the selling process. Start your journey towards a successful sale by exploring our resources and expert guidance today.